Birds eye view is a crucial element for every Project Portfolio Manager. You need to see crucial data at a glance. But how to do it? How to choose what data do you need? We will try to help you.


- What is dashboard?
- Why you need it?
- List of all projects with current status
- Budget
- Progress – Milestones
- Risks
- Don’t clutter it
- Need more info – check our course
What is dashboard?
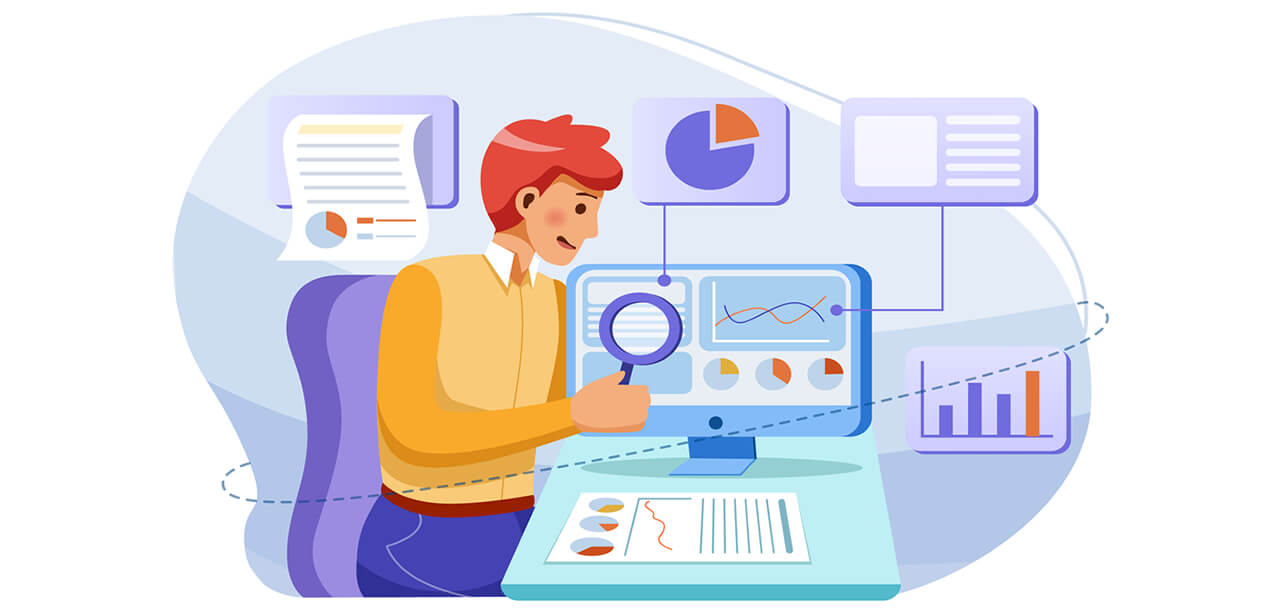
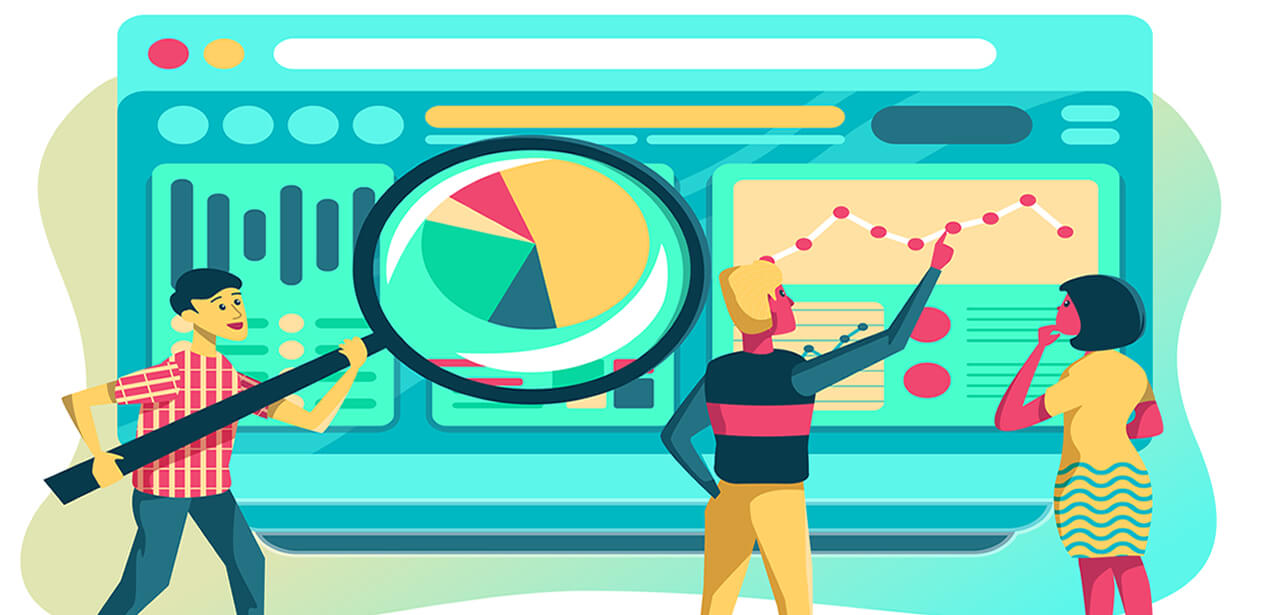
Data dashboard is a tool in which you can visually track most important factors of your whole portfolio of projects. We use term “tool” because it can be an Excel sheet, report from your management tool or special software dedicated only for that. All it matters is that you can track key parameters.
Why you need it?
You can have several dozen projects, twice (or more) as many team members, thousands of parameters in your project portfolio. But you need to look at your portfolio’s general health, general strategy and situation at this point. It’s impossible to track all date at once. It’s impossible and not needed. First of all you need to have easy access to a few key parameters. They will show you general situation and topic that you need to investigate further. That’s why you need good dashboard. To see what is most important and relevant for the whole portfolio.
So, what elements do we need?
List of all projects with current status. You need to have full list of projects in your portfolio. Every project in portfolio is important (of course some more, some less). You need to know their general situation – status. If something needs your attention, it should be seen in project status.
Budget
Money is not everything but for company money is very important. Tracking budget is crucial. You need to know in which project situation is under control and in which you need change.
Progress – Milestones
Tracking progress is very important. You need to know if general direction is ok or you need to make changes. In some cases project are related to each other. Small delay in one project can have huge impact on another.
Risks
You need to track what issues can be expected. There are so many factors you can’t predict. But many you can, you should and to be honest – you must.
Don’t clutter it
Main rule: less is better. Don’t try to put every data you’ve got on dashboard. You need only crucial data. If you can open your dashboard, look 60 seconds and identify all important things you need to do / investigate, your dashboard is ok. If you can’t you either have too many elements to focus on or you don’t have enough data on your dashboard.


